May 10, 2016
Q1 2016 Part1 - Share Price Performance for Canadian Healthcare Sector

In order to assess share price performance among the Canadian public healthcare companies, I select companies at the beginning of each year which are categorized in two ways: share price to start the year and type of company.
- The total number of companies which will be assessed on a quarterly basis has increased from 99 companies in 2015 to 116 companies to start 2016.
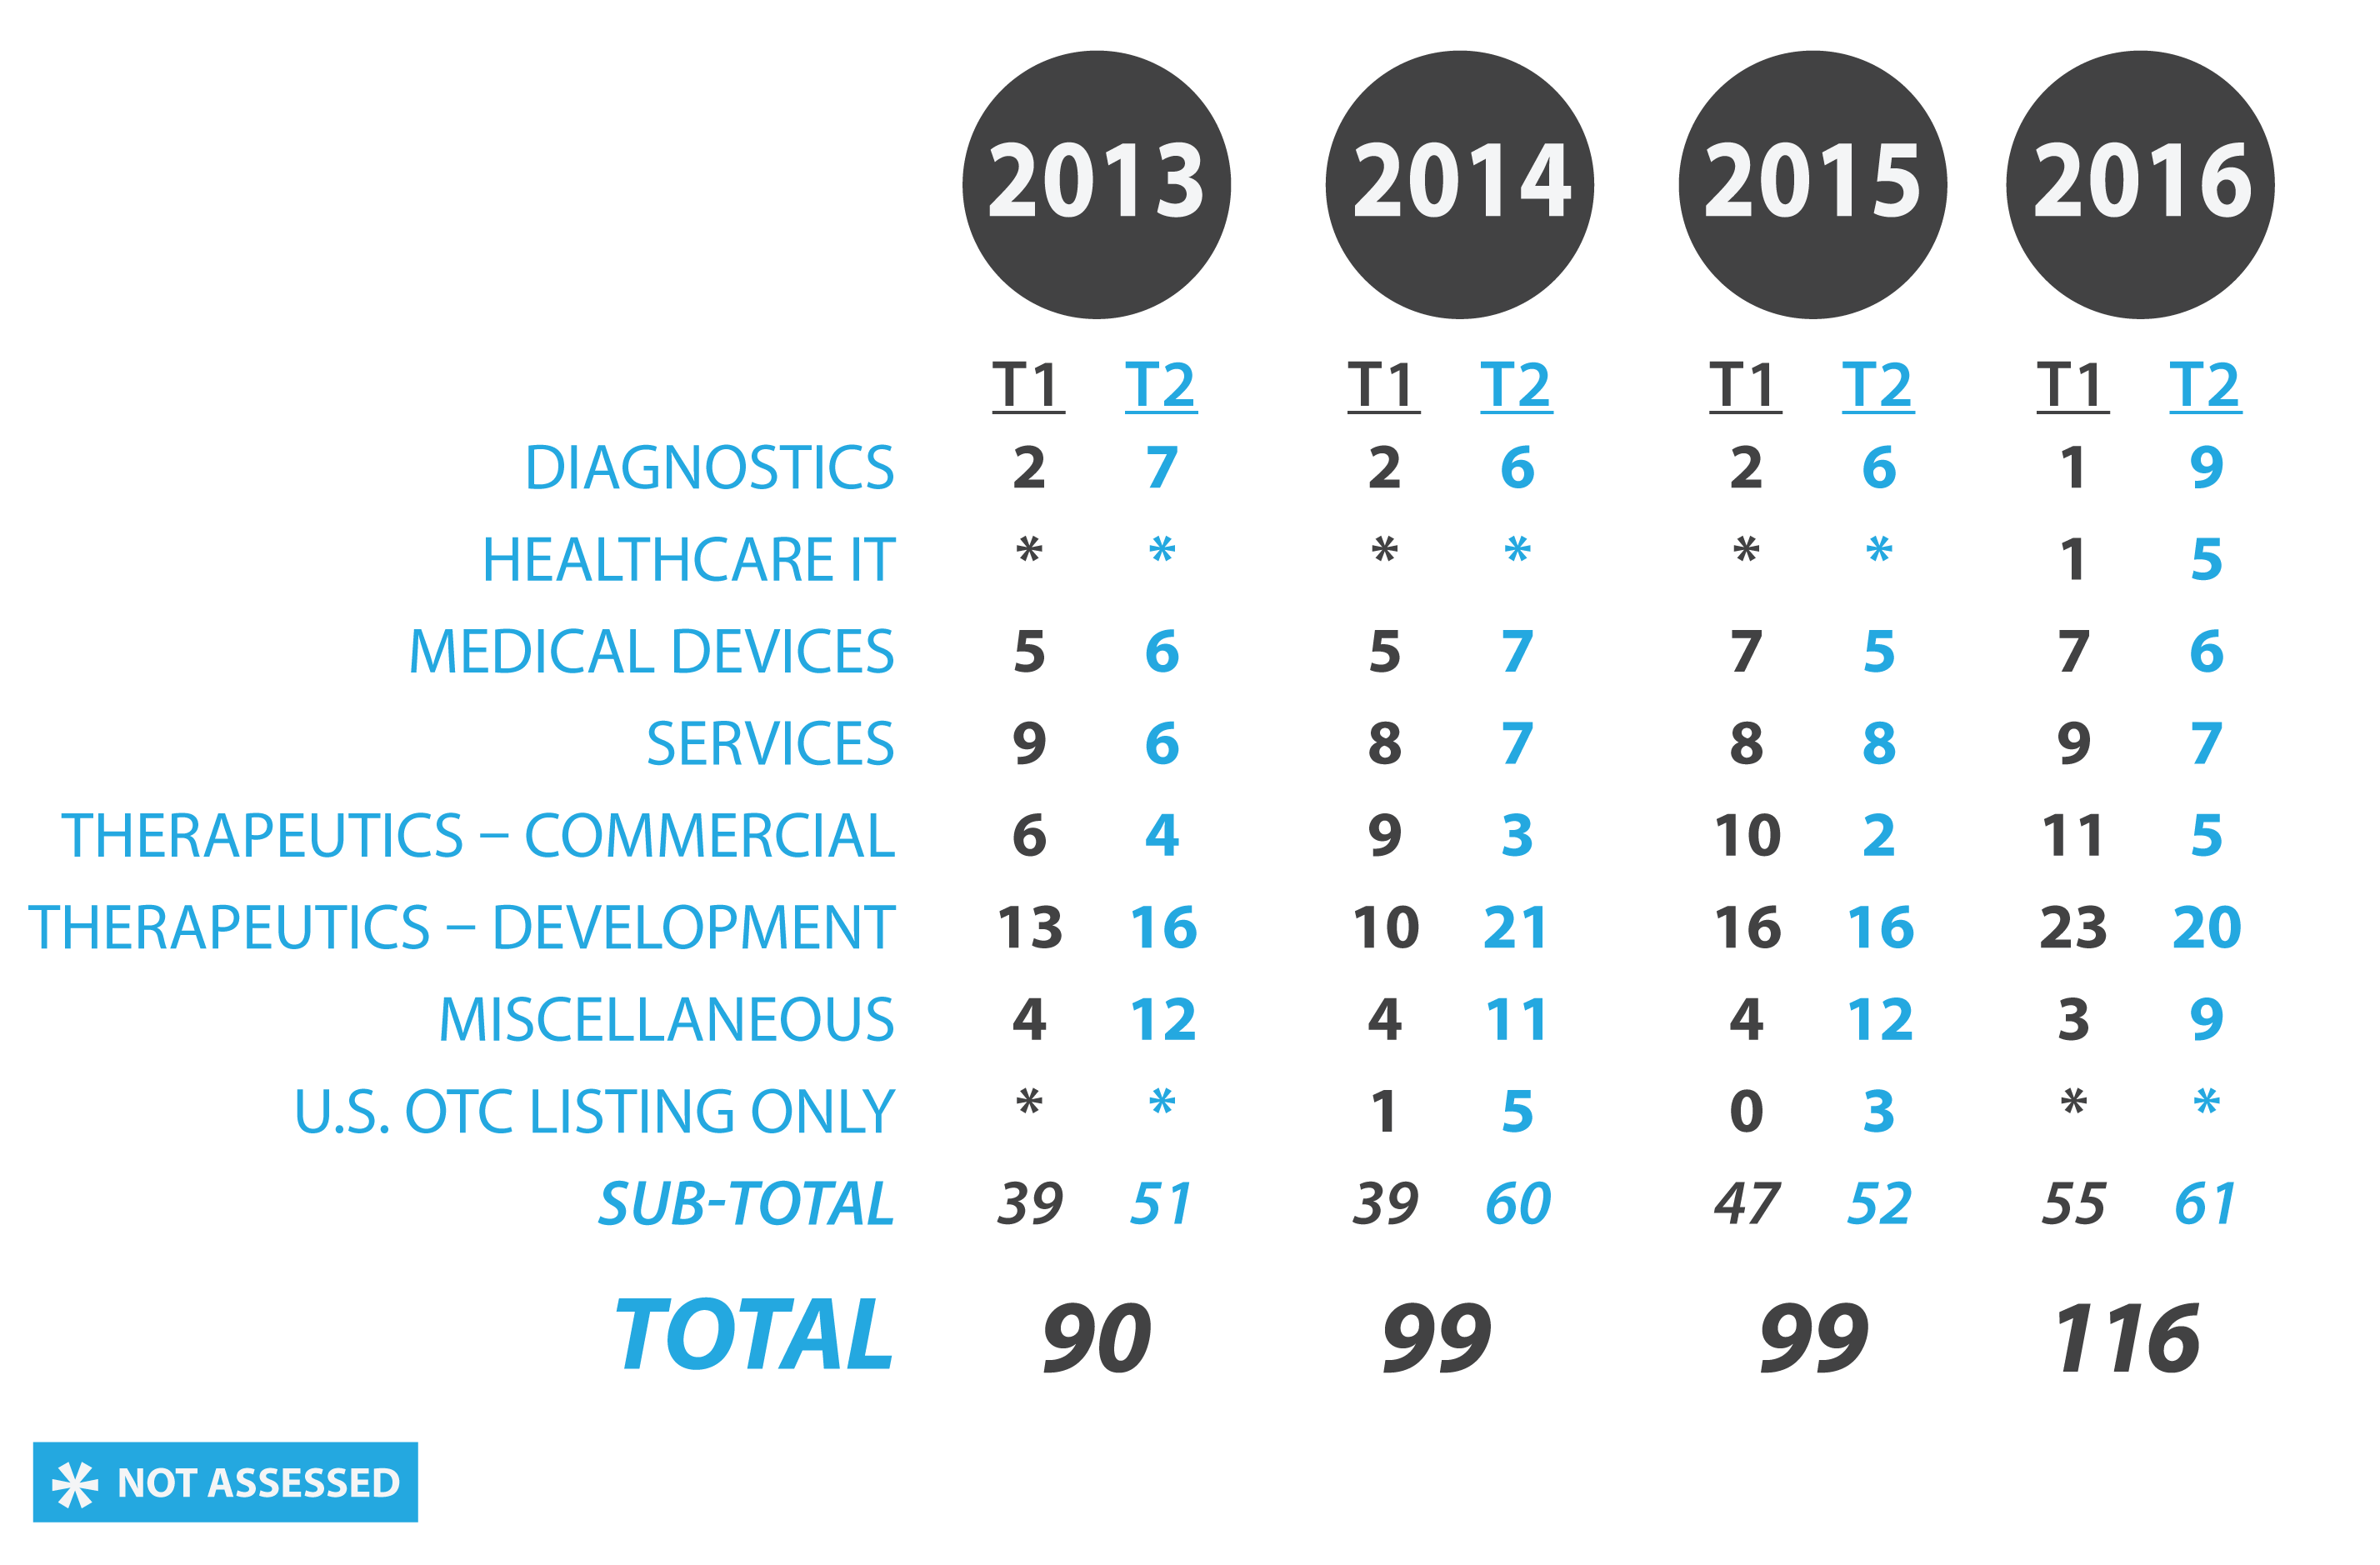
- The share price categories have remained the same: $1.00 or more (Tier 1), $0.10 to $0.99 (Tier 2). The number of Tier 1 companies has increased from 47 to 55 and the number of Tier 2 companies has increased from 52 to 61.
- A new ‘Healthcare IT’ company category has been added for 2016 and the ‘U.S. OTC Listing Only’ company category has been deleted.
- Some new companies will join the sector in 2016 but will not be included in the statistical analysis until 2017. The six new public Canadian healthcare companies in Q1 were Aralez Pharmaceuticals, Breathtec BioMedical, Crescita Therapeutics, Delivra, Lattice Biologics and Vaxil Bio.
- The share price performance of a group of 14 medical marijuana companies will be reported.
- There are 43 additional healthcare companies and 3 medical marijuana companies with share prices below $0.10 to start 2016 which will be monitored but only major events will be mentioned.
The following table compares the number of tier 1 (T1) and tier 2 (T2) companies in the various categories for 2013 through 2016. The biggest change was in the Therapeutics – Development category, with an increase of 11 companies from 2015 to 43 companies in 2016.
Overall, Q1 2016 share price performance in the sector was negative for the 116 companies starting 2015 with share prices of $0.10 or higher.
- Decliners outnumbered advancers by 73 to 43
- Eight companies with share price increases of 40% or more
- Seventeen companies had share price declines of 40% or more
- The average and median share price changes were -10%
An investor should ask ‘how does the average share price change of -10% compare with some benchmarks in Q1?’
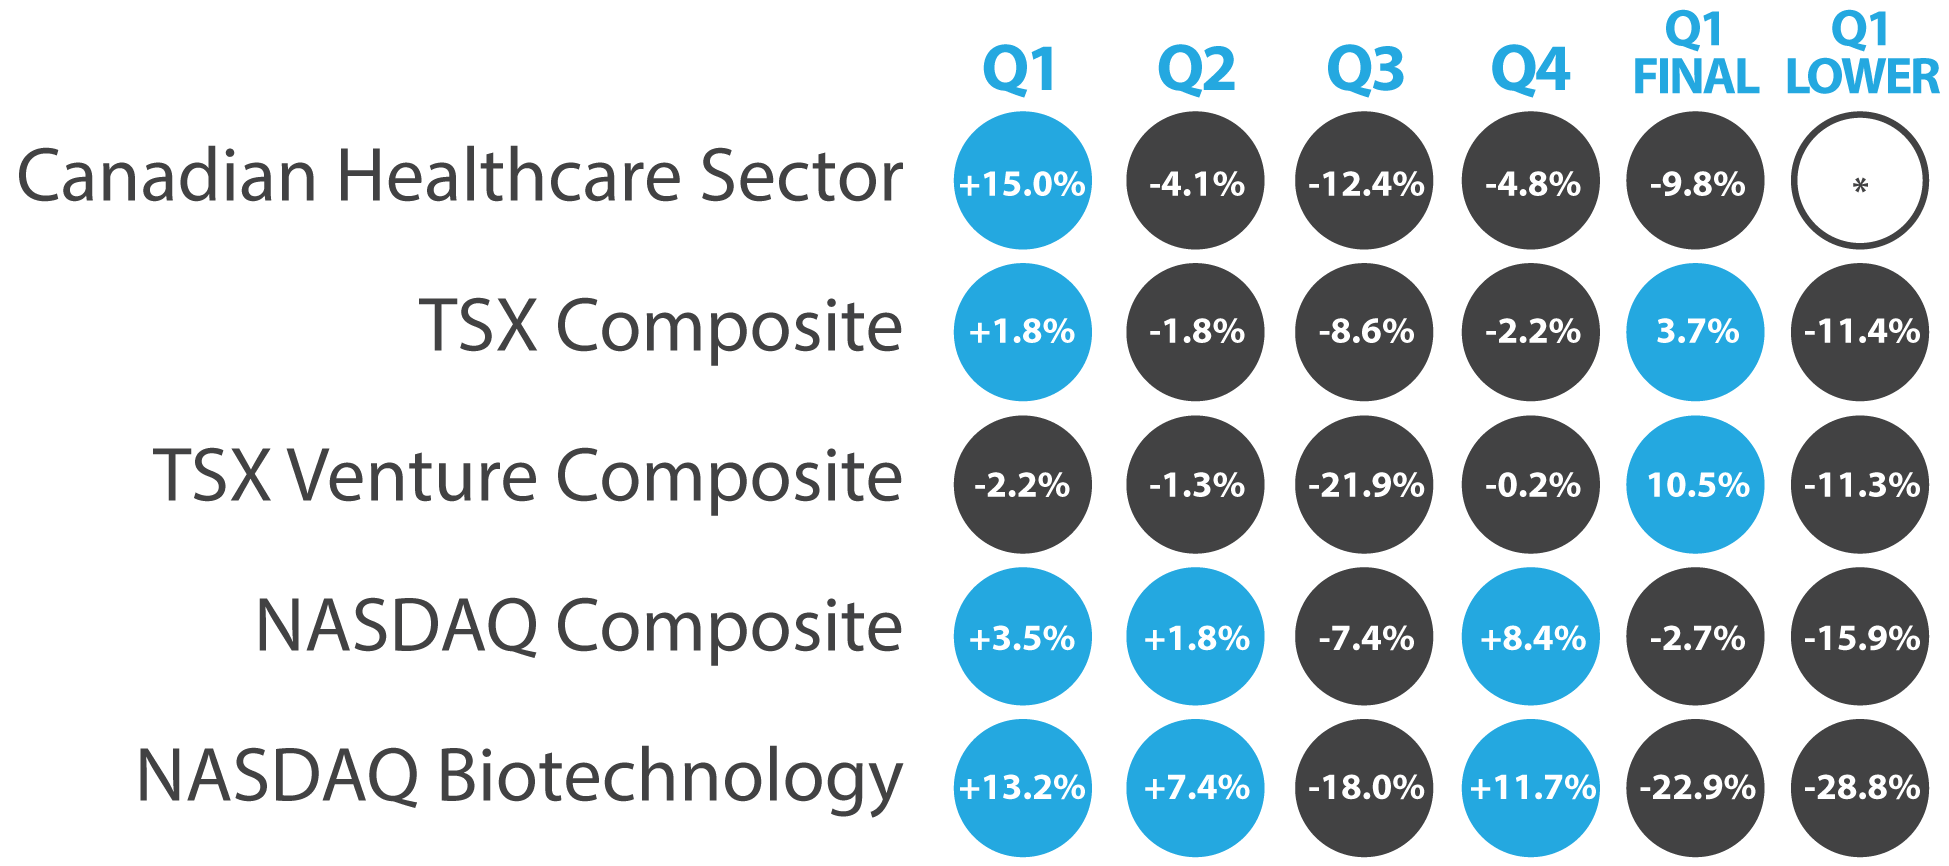
The performance of the four benchmarks which I use are shown in this table. The two TSX indices were positive because the price of oil increased and there was also positive momentum in mining company share prices. The technology and biotechnology-based NASDAQ was lower because of the substantial negative performance of the U.S. biotechnology sector due to politics and drug pricing concerns. However, the full Q1 story is missed if only the final Q1 performance is assessed. The initial Q1 movement for all indices was negative with a bounce during the latter part of the quarter. I expect the volatility in the biotechnology and healthcare share prices to continue.
In the next blog, I will assess the Q1 2016 share price performance of the Tier 1 Canadian healthcare companies.
[The author and his immediate family members may have long or short positions in the shares of some companies mentioned in or assessed during the preparation of this blog. Past share price performance may not be an indicator of future share price performance. This blog does not consider the investment objectives, financial situation or particular needs of any particular person. Investors should obtain professional advice based on their own individual circumstances before making an investment decision.]
As with all our posts, please see our full legal disclaimer.