April 24, 2015
Looking Inside the Biotech Black Box (Part 7)
Theratechnologies Case Study – was tesamorelin (EGRIFTA™) a success?
In Part 6 of this blog series, the clinical development history of tesamorelin was reviewed to the point where the Phase 3 trials were started. Success of the product and the company can be assessed in the following ways.
Phase 3 trials
Theratechnologies reported positive clinical outcomes for its Phase 3 trials. The final second trial data came 2 years after the first Phase 3 data because the company did not run the two Phase 3 trials simultaneously.
- December 19, 2006 26-week data, 1st trial
- October 1, 2007 52-week date, 1st trial
- June 18, 2008 26-week data, 2nd trial
- December 15, 2008 52-week data, 2nd trial
The following paragraph is from the latter press release and outlines the 52-week efficacy data from the 2nd trial.
Although the primary objective of the Phase 3 trials was to determine the long-term (52 weeks) safety profile of tesamorelin, the data regarding the efficacy of tesamorelin in this confirmatory trial replicated what was observed in the first Phase 3 trial. Those patients that were treated for 52 weeks in the confirmatory trial experienced a total reduction of 18% VAT compared to baseline (p<0.001) which is consistent with the results observed at 52 weeks in the first trial. Patients treated with tesamorelin for the first 26 weeks in the confirmatory trial experienced a total of 11% VAT reduction (p<0.001). Further aligned with these results, patients who were on the placebo arm for the first 26 weeks and were crossed over to treatment from weeks 26 to 52 had a decrease of 14% in VAT compared to baseline (p<0.001). Finally, patients treated with tesamorelin for 26 weeks followed by placebo for 26 weeks regained VAT to levels comparable to their baseline values (+1%, p=0.432).
Regulatory Approvals
The following are the critical dates concerning regulatory approval by the U.S. FDA. Approval by the FDA came almost 2 years after the 52-week data from the second Phase 3 trial was released.
- June 1, 2009 Announced filing of NDA
- May 27, 2010 Positive (16-0) recommendation by an FDA advisory committee
- November 11, 2010 Approval by the U.S. FDA
Regulatory success has been much more difficult in other countries. Theratechnologies, with then partner Ferrer, made the original filing in the EU on June 6, 2011 but was not granted approval. Based on company press releases, it appears that the EU regulators deemed VAT reduction was not a sufficient clinical benefit by itself and that a cardiovascular benefit would be expected if VAT reduction was clinically meaningful. Regulatory success was delayed in Canada until April 2014, after an initial rejection.
Sales & Revenues
Most small biotechnology companies license their first products to larger companies for marketing and sales either on a global or regional basis. Theratechnologies licensed exclusive U.S. rights to EMD Serono (an affiliate of Merck KGaA) in December 2008. Theratechnologies received an upfront payment of US$30 M, comprised of a license fee of US$22 M and an equity investment of US$8 M in Theratechnologies common stock at a price of US$3.67 per share. They received an additional US$25 M upon FDA approval of EGRIFTA.
In December 2013, Theratechnologies announced that it would be reacquiring the full U.S. rights to EGRIFTA, paying EMD Serono both a US$20 M fee spread over 5 years and royalties on sales. Investors would be wondering which company triggered this move or was it a mutual decision.
The following information is from the press release announcing Theratechnologies’ fiscal 2013 results.
- Revenue generated from sale of goods amounted to $2,544,000 in the twelve-month period ended November 30, 2013 compared to $5,235,000 in Fiscal 2012, reflecting lower shipments to EMD Serono and a lower selling price in Fiscal 2013.
- Royalties, which are almost entirely derived from the sales of EGRIFTATM, were $3,299,000 in Fiscal 2013 compared to $4,255,000 in Fiscal 2012.
An investor could safely assume that neither party was satisfied with EGRIFTA sales. There were manufacturing problems which impacted sales. The low sales and slow growth could also have been impacted by factors such as clinical data with no marketing power or a salesforce that was more interested in selling EMD Serono’s GH products, Saizen and Serostim. An investor would want to know whether Theratechnologies would establish its own sales and marketing group or find another partner.
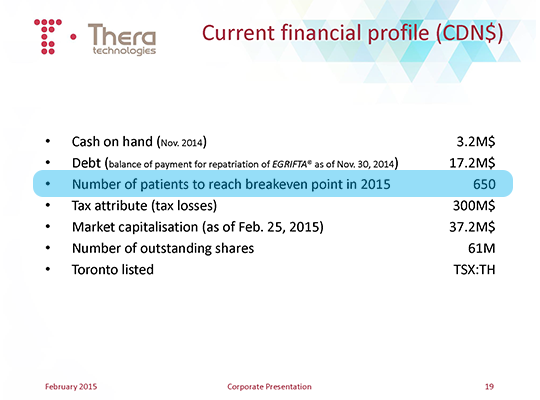
A recent presentation from Theratechnologies (http://www.theratech.com/sites/default/files/cp-feb-2015.pdf) has the following points on slide 13.
- Starting in the U.S. from a solid base
- Peak net sales of $34MM U.S.
- Peak number of patients of 1,300
- Regaining rights means a dedicated sales force to detail EGRIFTA® in the U.S.
- Agreement with InVentiv Health
- Recognized provider of commercial, clinical and consulting services to pharma companies around the globe
- InVentiv will manage commercial services and regulatory requirements in the U.S.
- Qualified and dedicated sales force will drive growth
- New pricing strategy
- Seeking broader reimbursement coverage
- EGRIFTA® is the sole focus for our team in the U.S.
The following financial point is on slide 19.
Share Price
Biotechnology is a sector where ‘buy and hold for several years’ during clinical and early commercial development is generally not a suitable strategy. Biotech investors are usually looking for share price doubles or even better over a shorter period of time. My perspective is that a biotech investment is a success if the share price doubles over a two-year period. The trigger for the investment could be a financing, a significant event or simply be a case of bottom-fishing.
The TH share price chart shows several distinct periods of share price movement.
- August 1996 to December 1999 – TH share price trades in a range around $5 with no opportunity for a double. This was not a good period for most early stage biotech companies.
- December 1999 to August 2002 – TH share price rose from $5 to almost $15 and back to $5. This was the time of the tech bubble, in which the NASDAQ index peaked on March 10, 2000. The tech bubble triggered the biotech bubble during which most biotech share prices and valuations were ridiculously high. However, this was a period in which most biotech share prices doubled or more.
- August 2002 to November 2005 – TH share price declined from about $5 to a bottom of about $1 during this period. The period after the biotech bubble was a difficult time for all biotech companies.
- November 2005 to January 2009 – TH share price climbed from about $1 to about $12 in May 2007 and then dropped back to about $1.50. The first Phase 3 study was started in June 2005, the first Phase 3 data was released in December 2006 and the EMD Serono licensing deal was signed in December 2008. There was a strong biotech financing climate in the first half of this period and a global financial crisis in the second half of this period.
- January 2009 to November 2012 – TH share price climbed from about $1.50 to almost $6 in January 2011 and then declined to about $0.25. The final Phase 3 data was released in December 2008, which resulted in a path to regulatory approval at the same time that global markets were recovering from the financial crisis. The share price peaked at about the time EMD Serono launched EGRIFTA in the U.S. market. This is also the time at which the higher-risk clinical-stage investors depart and the commercial-stage investors purchase this stock.
- November 2012 to present – TH share price bounced between $0.20 and $0.50 for 2 years and then climbed over $1 in Q1 2015, closing at $1.24 on April 13th.
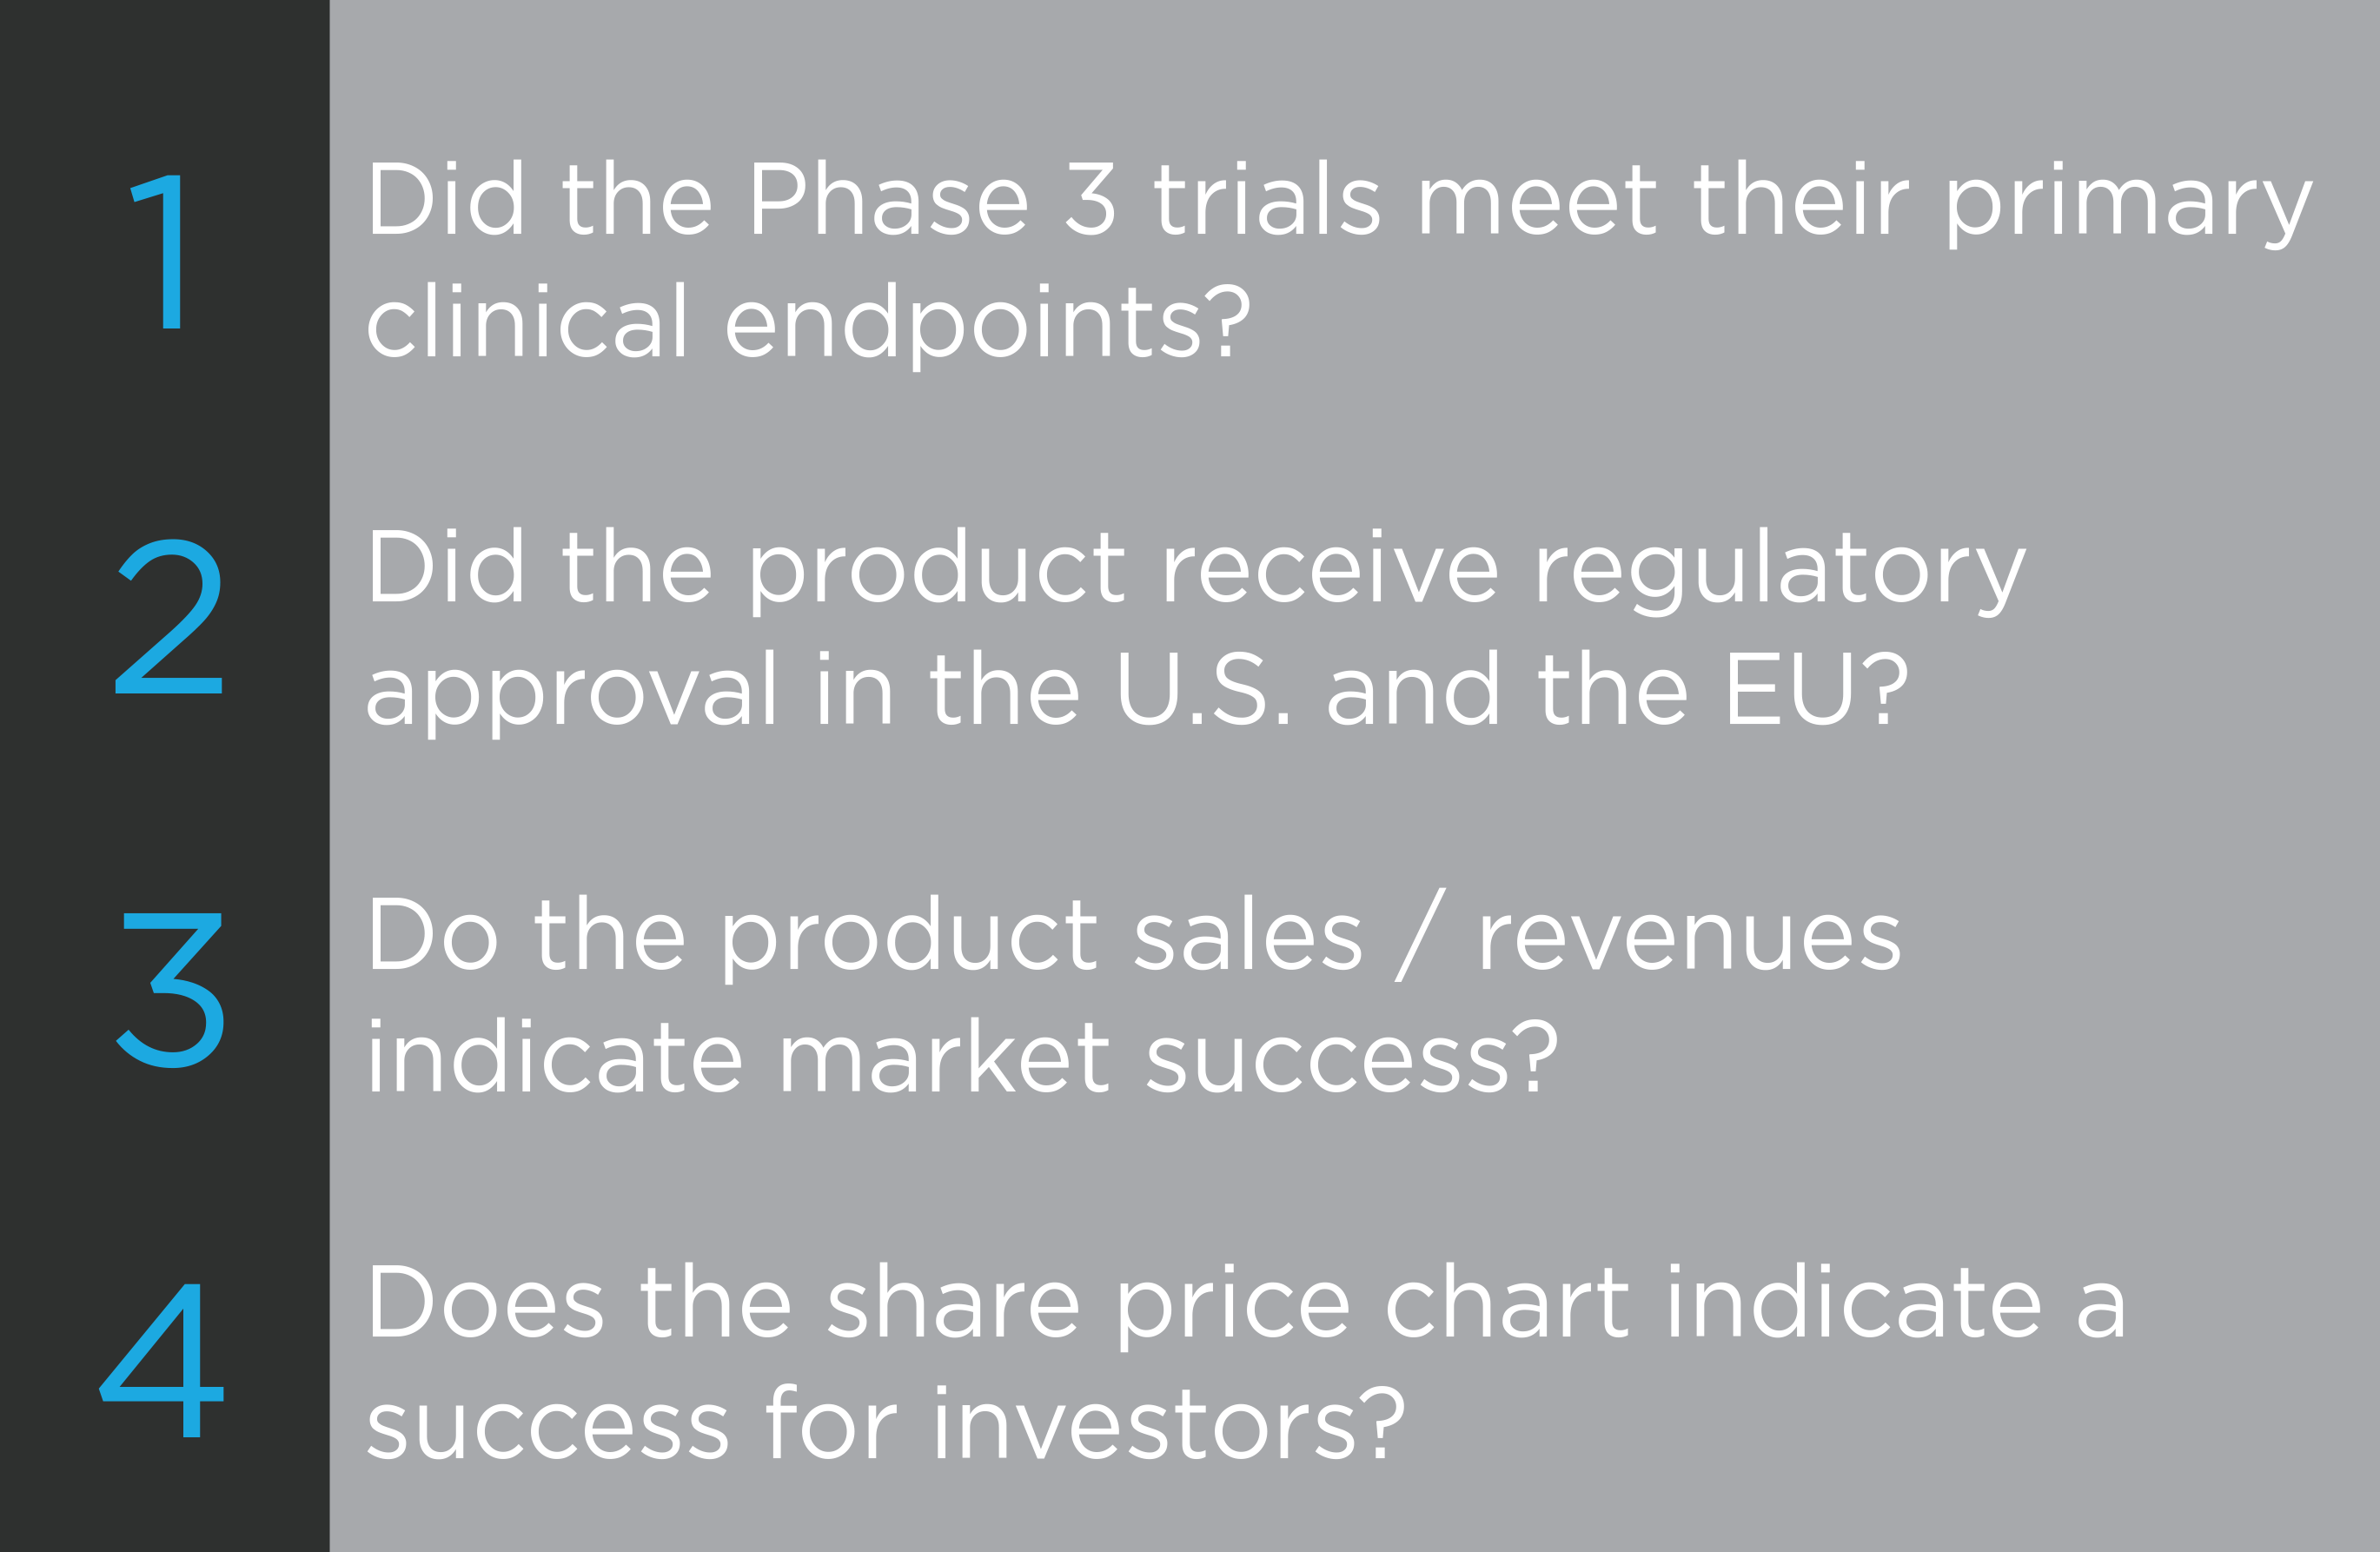
The answers to the four success questions are:
- Clinical – yes
- Regulatory – yes
- Sales – no (current answer)
- Investors – it depends on your timing and strategy
While this is my last blog on the Theratechnologies case study, the Theratechnologies story is not over and the answers to the latter two success questions could change.
The apparent reason for the EU decision to not approve EGRIFTA prompted my selection of the subject for the 8th part of this blog series – the cost-effectiveness and affordability of new therapeutics.
[The author and his immediate family members may have long or short positions in the shares of some companies mentioned in or assessed during the preparation of this blog. Past share price performance may not be an indicator of future share price performance. This blog does not consider the investment objectives, financial situation or particular needs of any particular person. Investors should obtain professional advice based on their own individual circumstances before making an investment decision.]
As with all our posts, please see our full legal disclaimer.